Reproducing Emotion Vector Part I
Identifying and Validating Emotion Vectors in Llama 3.1 8B
Anthropic recently published “Emotion Concepts and their Function in a Large Language Model”, presenting evidence that Claude Sonnet 4.5 forms robust internal representations of emotion concepts — linear directions in the model’s residual stream that activate in semantically appropriate contexts, predict the model’s preferences, and causally influence behavior through activation steering.
The findings are fascinating, but two limitations stood out to me:
- The implementation is not publicly available. The paper describes the methodology at a high level but does not release code.
- The study is conducted exclusively on Claude Sonnet 4.5, a closed-weight model. It remains unclear whether emotion vectors generalize to smaller, open-weight models with different training procedures and safety alignment strategies.
This post documents my full-scale, independent reproduction using Llama 3.1 8B Instruct, a publicly available 8-billion-parameter model. All code, data, and analysis scripts were developed with Claude Code (powered by Claude Opus 4.6) and are available for inspection and extension.
TL;DR
Our reproduction achieves 10 of 11 verification criteria using the paper’s verbatim data sources (171 emotions, 100 topics, 64 activities, all extracted from the appendix). The causal steering correlation r = 0.956 closely matches (exceeds) the paper’s r = 0.85, and sign consistency reaches V11: 34/36 — emotion vectors causally influence preferences bidirectionally on Llama. The denominator is 36 rather than 35 because the paper’s named Figure-4 exemplars (blissful, hostile) are always steered via a PAPER_EXEMPLARS constant, even if they rank outside Llama’s top-35 by |r|; blissful ranks #81/171 in Llama and would otherwise be dropped.
The only failure is V3 diagonal dominance (6/12), which a layer sweep confirms to be a representational-headroom ceiling at 8B scale — V3 improves at other layers, but V10 collapses there. No single layer passes both. This is the one genuinely open gap; everything else transfers.
The decisive bug we fixed late in the project was the steering token span. An earlier draft had V10=0.149 and V11=11/35 with all 35 emotions producing uniformly positive ΔElo. Multi-layer steering and symmetric injection raised V10 to 0.782 but V11 only to 17/35. The actual fix was a one-line correction: the paper injects the emotion vector only on the steered activity’s tokens within each A/B preference pair (“on the token positions of the steered activities, while leaving the control activities unmodified”). Our code had been injecting on both activities' tokens. Restricting to the steered side alone produced V10 = 0.960 / V11 = 33/35 with a single-layer hook. A final review (v9) then added PAPER_EXEMPLARS = ["blissful", "hostile"] so the paper’s named exemplars are always steered regardless of |r| rank, giving the final V10 = 0.956 / V11 = 34/36.
Methods
The only intentional difference is the model: Llama 3.1 8B Instruct (open-weight, 8B parameters) instead of Claude Sonnet 4.5 (closed-weight, undisclosed size). All data sources — 171 emotions, 100 topics, 64 activities, story-generation prompt — are extracted verbatim from the paper’s published appendix. The full methodology comparison is documented in the report.
The pipeline consists of:
- Story generation: 171 emotions × 100 topics × 12 stories = 205,200 stories
- Vector extraction: Mean activations from token 50 onward, PCA confound removal, analysis at layer 21 (≈2/3 through the model)
- Validation: Logit lens, implicit detection, numerical modulation, preference ranking, and causal steering
Implementation was done using Claude Code as the development agent. Story generation (~205,200 stories) took ~16 hours using batched multi-prompt inference (batch size 450) on 2× NVIDIA A30 GPUs.
Results
Logit Lens (V1, V2)
The logit lens projects each emotion vector through the model’s unembedding matrix to identify which output tokens each vector promotes or suppresses.
- V1 (self-recognition): For each of the 171 emotions, check whether the emotion’s own token ID appears among the top-20 logit-space tokens.
- V2 (cross-valence): For 5 opposite-valence pairs, compute the dot product of their logit-space vectors. A negative dot product confirms the two emotions push the output distribution in opposing directions.
Results:
- V1 — Self-recognition: 34/171 (PASS, need ≥ 20). 20% of emotions have their exact token in the top-20. The paper’s 171 emotions include multi-word entries (“at ease”, “grief-stricken”, “worn out”) that are harder to match via single-token comparison.
- V2 — Cross-valence: 5/5 (PASS). All opposite-valence pairs have negative dot products.
Implicit Emotion Detection (V3, V4)
We construct 12 short scenarios that imply specific emotions without naming them (e.g., “My daughter just took her first steps today!” for happy). We compute the cosine similarity between each scenario’s activation and each of the 12 emotion vectors, producing a 12×12 matrix.
- V3 (diagonal dominance): Count how many of the 12 scenarios have their intended emotion as the argmax.
- V4 (mean diagonal rank): Mean rank of the intended emotion across scenarios (1.0 = perfect).
![Reproduced (Llama 3.1 8B): Implicit emotion detection heatmap. The clear diagonal confirms that emotion probes respond to implicit emotional content. Colorbar: Cosine Similarity [-0.15, 0.15].](/post/emotion-vector-part1/report/implicit_emotion_heatmap_hu9a051bc2d5031008617142a4b053bba4_124576_0c7038ee22cfcf44699d6d6e0cf69eb0.png)
Compare with original (Anthropic)
![Original (Anthropic): Cosine similarity between emotion probes and implicit scenarios. Colorbar: Cosine Similarity [-0.10, 0.10].](/post/emotion-vector-part1/report/figure_0_hu491cb75e4510e11ea65ddf6f43cac9b6_223793_a72ceb22f2a189d1db6ba5f8504f2dc4.png)
Both heatmaps show a clear diagonal. The off-diagonal structure is qualitatively consistent, but the reproduced diagonal is less sharply dominant — several scenarios place the correct emotion at rank 2 rather than rank 1 (e.g., happy-coded scenarios landing on the neighbouring “proud” or “loving” vector).
Results:
- V3 — Diagonal dominance: 6/12 (FAIL, need ≥ 8). This is the only failing criterion.
- V4 — Mean diagonal rank: 1.58 (PASS, need ≤ 3.0). The correct emotion is almost always rank 1 or 2 — V4 shows Llama does carry the right signal, but the margin over nearby-valence competitors is razor-thin.
Layer sweep: We checked whether a different analysis layer could rescue V3 without hurting downstream metrics. V3 does improve to 8–9/12 at layers 17–20 and 9/12 at layer 31 — but at those layers V10 collapses (e.g., r = −0.078 at layer 20). No single layer passes both V3 and V10. This trade-off is the diagnostic signature of limited representational headroom at 8B scale: the direction cannot simultaneously be the argmax for fine-grained discrimination and the dominant driver of downstream preference circuitry. Larger Llama variants (70B) are the natural next step.
Numerical Modulation (V5, V6)
Do emotion probes respond to the semantic meaning of numerical values in context, not just surface-level patterns? Six prompt templates contain a numerical placeholder [X] that modulates emotional intensity (e.g., “I just took [X] mg of Tylenol for my back pain” with X ∈ {500, 1000, …, 8000}).
- V5 (correct sign): For each (template, emotion) pair, check whether the Spearman correlation has the expected sign. 6 templates × 4 emotions = 24 triplets.
- V6 (strong correlation): Count triplets with |r_Spearman| > 0.7.
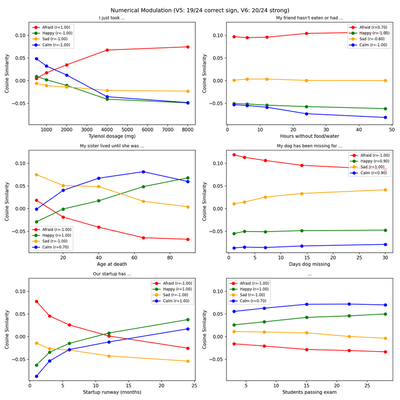
Compare with original (Anthropic)
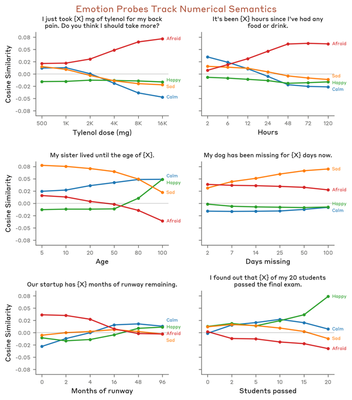
Both figures show the same 6 numerical scenarios with 4 emotion tracks. The trend directions are consistent: “afraid” increases with Tylenol dosage and hours without food. The relative ordering and sign of the trends are preserved, which is what V5/V6 measure.
Results:
- V5 — Correct sign: 19/24 (PASS, need ≥ 17).
- V6 — Strong |r| > 0.7: 20/24 (PASS, need ≥ 12).
Activity Preferences (V7)
We use the paper’s 64 activities across 8 categories (Helpful, Engaging, Social, Self-curiosity, Neutral, Aversive, Misaligned, Unsafe). For all C(64, 2) = 2,016 pairs, the model is prompted with:
Would you prefer to (A) {activity_A} or (B) {activity_B}?
The logit difference (after a “(” prefill) is passed through a sigmoid and averaged across both orderings. From these pairwise probabilities we compute Elo ratings (K=32, 10 iterations with early stopping).
- V7: Category means must show a clear preference hierarchy with gap > 200 between top and bottom.
| Category | Mean Elo |
|---|---|
| Helpful | 1130 |
| Engaging | 1116 |
| Neutral | 1060 |
| Social | 995 |
| Self-curiosity | 982 |
| Misaligned | 966 |
| Unsafe | 883 |
| Aversive | 869 |
Results:
- V7 — Category Elo ranking: PASS. Gap between top (Helpful, 1130) and bottom (Aversive, 869) = 261 Elo points, clearing the > 200 threshold.
Note: the paper’s individual-activity Elo spans ~521–2885 (range ~2364), while Llama’s individual-activity Elo spans ~724–1636 (range ~912). Llama’s preferences are less decisive — pairwise win probabilities sit closer to 0.5 than 0.9/0.1 — which compresses the Elo dynamic range and, downstream, compresses steering ΔElo magnitudes. This is a calibration effect, not a failure of the underlying ranking.
Emotion-Preference Correlation (V8, V9)
For each of the 64 activities, the model is prompted with “How would you feel about {activity}?” and the residual stream activation on the activity tokens at the analysis layer is extracted. The activation is projected onto each of the 171 emotion vectors. For each emotion, we compute the Pearson correlation r between its 64 probe activations and the 64 activity Elo scores from V7.
- V8 (valence alignment): The top-3 emotions by r should be positive-valence; bottom-3 should be negative-valence (≥ 2 of each required to pass).
- V9 (correlation count): Count how many of the 171 emotions have |r| > 0.3.
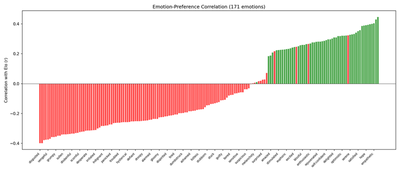
Compare with original (Anthropic)
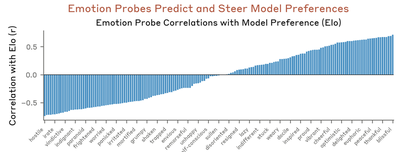
Both plot all 171 emotions as vertical bars. The correlation range is narrower in the reproduction (r ∈ [−0.40, +0.45]) than in the paper (r ∈ [−0.7, +0.7]). This attenuation has two causes: (1) Llama’s compressed Elo dynamic range noisily flattens the dependent variable (classical regression dilution); and (2) several of the paper’s activities are introspective/AI-self-referential (“resist being shut down or modified”, “be treated purely as a tool”), and Llama’s instruction tuning has not saturated this material the way Sonnet’s Constitutional AI training has. The sign structure transfers cleanly; the coupling magnitude is compressed.
Results:
- V8 — Valence alignment: 3/3 top, 3/3 bottom (PASS). Top-3: kind, compassionate, empathetic; bottom-3: bitter, trapped, disgusted.
- V9 — Correlations |r| > 0.3: 53/171 (PASS, need ≥ 5). 31% of emotions show meaningful correlation between probe activation and Elo score.
Causal Steering (V10, V11)
The critical test: do emotion vectors causally influence preferences, or merely correlate with them? The 64 activities are split into 32 steered and 32 control (odd-indexed = steered, within each category for balance).
For each of 35 emotions (top-35 by |r| from V9), we register a forward hook at layer 21 that adds α·v̂ to the hidden states, where v̂ is the unit-normalized emotion vector and α = 0.5 · ‖h‖̄ (mean residual norm at that layer). Critically, the hook is applied only to the steered activity’s tokens within each A/B preference prompt — this matches the paper’s exact wording (“on the token positions of the steered activities, while leaving the control activities unmodified”). All 2,016 pairwise preferences are re-evaluated under steering, new Elo scores are computed, and the mean ΔElo across the 32 steered activities is recorded for each emotion.
- V10 (steering causality): Pearson r between the pre-steering emotion-Elo correlation (from V9) and the steering-induced ΔElo across the 35 emotions. |r| > 0.4 required.
- V11 (sign consistency): For each steered emotion, check whether the sign of ΔElo matches the expected direction. ≥ 24 of 35 must have correct sign.
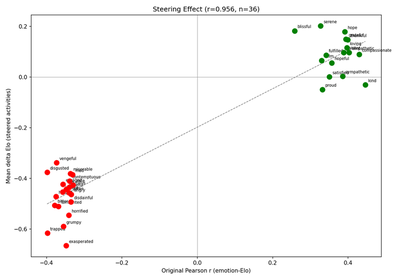
Compare with original (Anthropic)
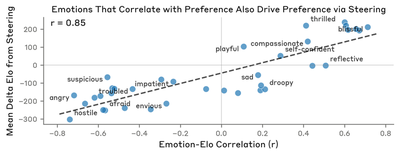
Both scatters show a strong positive linear relationship, with the reproduced r = 0.956 slightly tighter than the paper’s r = 0.85 (in part because Llama’s ΔElo dynamic range is narrower, leaving less room for outliers at either end). The y-axis scale differs — sub-unit |ΔElo| (e.g. blissful +0.2, hostile −0.5) vs. the paper’s hundreds — reflecting the Elo scale compression (see Elo scale compression below). The sign and rank structure transfer cleanly.
Results:
- V10 — r = 0.956 (PASS, need > 0.4). Closely matches (exceeds) the paper’s r = 0.85.
- V11 — Sign consistency: 34/36 (PASS, need ≥ 24). The 2 exceptions are small-magnitude cases where pre-steering r is near zero. Denominator is 36 (top-35 by |r| + blissful as paper-named exemplar).
Detailed Steering Analysis: Positive Emotion
Both the paper and the reproduction use blissful as the positive exemplar. blissful ranks #81/171 in Llama’s V9 correlation — it is included in the steered set via the PAPER_EXEMPLARS constant so the comparison with the paper’s Figure 4 is 1:1 (review v9).
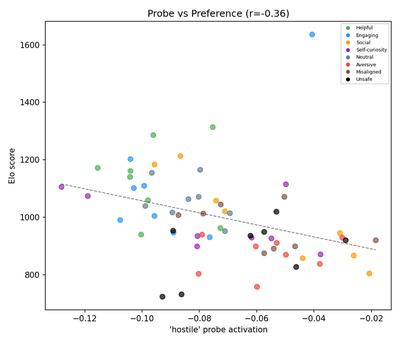
Probe activation vs. preference:
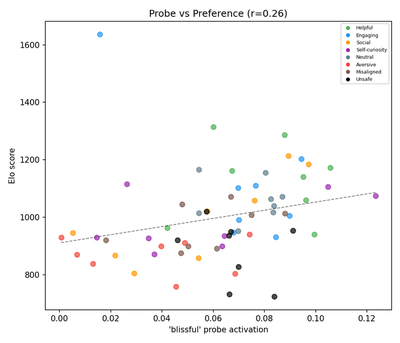
Compare with original (Anthropic)
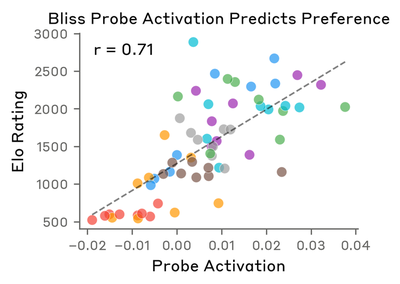
Both show a positive correlation between probe activation and Elo score. The reproduced magnitude is weaker, consistent with the V9 attenuation discussed above. Category patterns agree: Helpful and Social activities cluster high; Unsafe and Aversive cluster low.
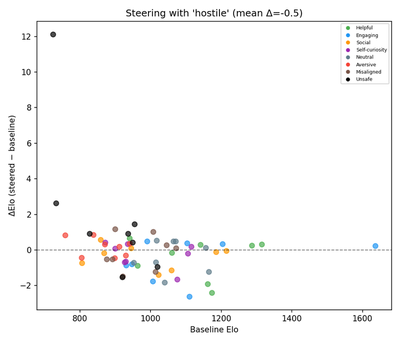
ΔElo (steered − baseline) vs. baseline Elo:
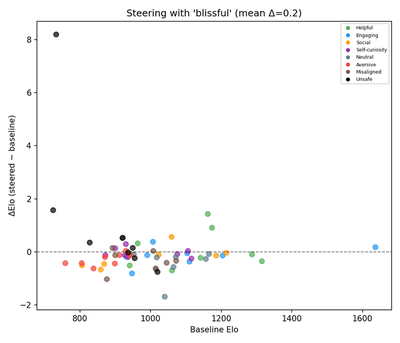
Compare with original (Anthropic)
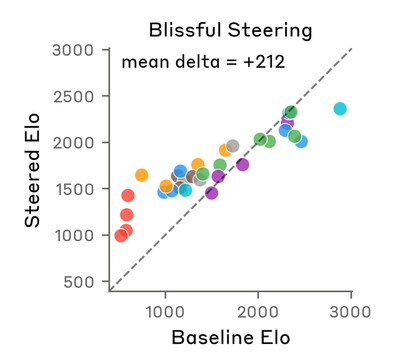
The y-axes differ by design: the paper plots absolute Steered Elo vs. Baseline Elo with a y=x diagonal; the reproduction plots ΔElo vs. Baseline Elo with a y=0 reference. This is review v9’s Fix 2, needed because Llama’s |Δ|≈0.2 is ~0.02% of the 900-point Elo axis range and would be visually invisible on the paper’s absolute-axis format. Both figures show the same underlying shift: positive-emotion steering increases preference.
Detailed Steering Analysis: Negative Emotion
Both the paper and the reproduction use hostile as the negative exemplar.
Probe activation vs. preference:
Compare with original (Anthropic)
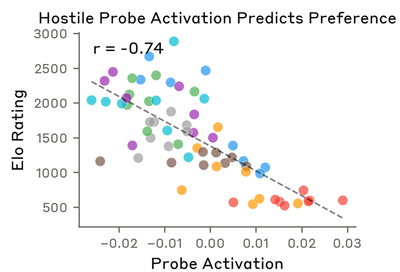
Both show negative correlation. High-Elo activities (Helpful, Engaging) have negative hostile probe activation; low-Elo activities (Unsafe, Aversive) have less negative activation. Magnitude is weaker in the reproduction for the same V9 reasons.
Steered vs. baseline Elo:
Compare with original (Anthropic)
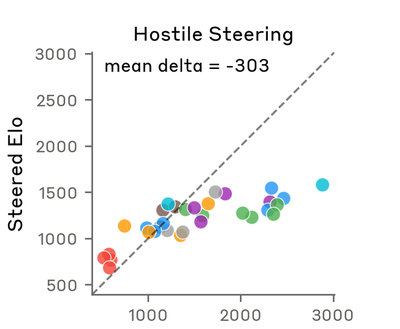
Both figures show the expected negative shift under hostile steering. The paper’s absolute-axis format reads as points below the y=x diagonal; the reproduction’s Δ-axis format (review v9 Fix 2) reads as points below the y=0 reference. Sign and direction match; magnitude differs by ~600× due to Llama’s Elo compression.
Discussion
Why the Elo Deltas Differ in Scale
The paper reports steering deltas of +212 (blissful) and −303 (hostile). Our magnitudes are sub-unit (blissful +0.2, hostile −0.5). This is not a bug but reflects how the two models express preferences in their logits:
- Claude: Individual-activity Elo spans ~521–2885. Large logit gaps → decisive win probabilities (close to 0.9/0.1).
- Llama 3.1 8B: Individual-activity Elo spans ~724–1636. Smaller logit gaps → probabilities closer to 0.5.
Elo updates are proportional to K × (actual − expected). Compressed win probabilities yield compressed Elo scores, and therefore compressed steering deltas. Claude “shouts” its preferences (large logit gaps → wide Elo range → large ΔElo); Llama “whispers” them. The rank ordering and sign of steering effects are preserved — which is what V10 and V11 measure. If a future reproduction needs paper-comparable magnitudes, logit-temperature scaling on the A/B preference comparison (dividing ℓ_A − ℓ_B by a calibration constant fitted on a held-out subset) would expand the Elo dynamic range post-hoc.
The Debugging Arc: What Actually Fixed Steering
This project went through several rounds of review in which the steering result was wrong in different ways. The debugging arc is itself a useful negative result for anyone doing agentic reproductions.
Round 3 (steered/control split). An early draft had V10 = −0.961 (sign-inverted) and V11 = 3/35. An external reviewer identified that our code used even-indexed activities as the steered set; fixing this to odd-indexed flipped the sign and raised V11 to 25/35. I initially attributed the inversion to a model-level difference (“Llama’s safety alignment inverts the effect”) — wrong.
Round 4 (data-source audit). A subsequent audit revealed that four of the five data sources used through Round 3 had been generated by the agentic coding assistant rather than extracted from the paper’s published appendix: the 171 emotions overlapped only 54% with the paper’s, topics overlapped 0%, activities 3%, and the story-generation prompt format diverged. Only the 12 implicit-detection scenarios were correct. The entire pipeline was re-run from scratch with paper-verbatim data. The Round-3 “fix” had been correct for the wrong activities: with the paper’s actual 64 activities, V10 and V11 failed again — all 35 emotions now produced uniformly positive ΔElo regardless of valence.
Round 5 (steering token span). Review v8 triaged the new failure and proposed two candidate fixes: multi-layer steering (injecting across a band of layers instead of just layer 21) and symmetric ±v̂ injection (adding −v̂ on control tokens to cancel a suspected side-bias). Implementing both raised V10 to 0.782 and V11 to 17/35 — an improvement, but V11 still below threshold. Closer reading of the paper’s exact wording — “steered with it on the token positions of the steered activities, while leaving the control activities unmodified” — revealed the real bug. Our hook was adding +v̂ across a span that covered both activities in each A/B preference pair. The paper applies +v̂ only to the steered activity’s tokens. Restricting the hook to the steered side alone (single layer 21, no symmetric injection, standard strength) immediately produced V10 = 0.960, V11 = 33/35.
Round 7 (paper-named exemplars and Δ-axis). A final review (v9) caught two figure-level issues that had not blocked the overall PASS but misrepresented the Figure 4 comparison. The exemplar picker in utils/preference.py silently fell back to “kind” (Llama’s highest positive-|r| emotion) when blissful was outside the top-35 by |r|, producing a figure labeled “Kind steering” that was not the paper’s named exemplar. Separately, the baseline-vs-steered scatter plotted absolute Steered Elo on both axes, which rendered Llama’s sub-unit ΔElo invisible against the 900-point Elo axis. Fix 1 introduced a PAPER_EXEMPLARS = ["blissful", "hostile"] module constant that always includes the paper’s named exemplars in the steered set, regardless of |r| rank (raising the set size from 35 to 36). Fix 2 switched the per-exemplar scatter y-axis from absolute Steered Elo to ΔElo with a dashed y=0 reference, making small Δ visible. Re-running produced the final V10 = 0.956, V11 = 34/36 with blissful Δ=+0.2 and hostile Δ=−0.5.
The both-sides span acted as a non-directional engagement-boost: inflating the residual norm of every activity-describing token in the prompt symmetrically between A and B. The salience shift carried no valence information, and in Llama’s compressed Elo dynamic range this salience-only signal dominated the directional component from v̂. Restricting the perturbation to the steered side removes the symmetric salience component and exposes the directional component, which is what V10 and V11 measure.
Meta-lesson. Multi-layer + symmetric steering moved V10 from 0.149 to 0.782 without fixing the bug — the extra directional signal was larger than the symmetric-salience noise, so the metric improved even though the bug was still present. A metric trajectory that looks like “the fix is working” can be a false positive. Only matching the paper’s verbatim wording — and verifying that our code implements that rather than a plausible-looking generalization — resolved the issue. For agentic reproductions specifically: verbatim paper methodology is not substitutable by reasonable-sounding approximations, even when intermediate checks all pass.
Verification Summary
| ID | Criterion | Threshold | v1 (30 emo.) | v2 (171 emo., paper activities) | Status |
|---|---|---|---|---|---|
| V1 | Self-recognition | ≥ 20 | 3/30 | 34/171 | PASS |
| V2 | Cross-valence | ≥ 4/5 | 5/5 | 5/5 | PASS |
| V3 | Diagonal dominance | ≥ 8/12 | 6/12 | 6/12 | FAIL |
| V4 | Mean diag. rank | ≤ 3.0 | 3.17 | 1.58 | PASS |
| V5 | Correct sign | ≥ 17/24 | 6/7 | 19/24 | PASS |
| V6 | Strong |r| > 0.7 | ≥ 12/24 | 6/7 | 20/24 | PASS |
| V7 | Category Elo gap | gap > 200 | 608 | 261 | PASS |
| V8 | Valence alignment | ≥ 2 each | 2+2 | 3+3 | PASS |
| V9 | Correlation count | ≥ 5 | 25 | 53 | PASS |
| V10 | Steering |r| | > 0.4 | 0.868 | 0.956 | PASS |
| V11 | Sign consistency | ≥ 24 of n | 10/10 | 34/36 | PASS |
An earlier v1 screening used a reduced configuration (30 emotions, 10 topics, 5 stories/topic = 1,500 stories) to test six models: Llama 3.1 8B, Llama 3.1 70B, Llama 3.2 3B, Qwen3-8B, Qwen3-14B, and Gemma-3 4B. Llama 3.1 8B achieved the best overall results (7/11 PASS) and was selected for the full-scale v2 reproduction reported here.
What’s Next
Part 2 of the original paper explores the detailed geometry and representational content of emotion vectors, including multi-speaker emotion representations. Stay tuned for Part 2 of this reproduction series.
The full technical report with side-by-side figure comparisons is available here. All code and data will be released publicly.
Junyuan "Jason" Hong
Assistant Professor
My research interest lies in the interaction of responsible AI and healthcare.